
How To Scale a Slurm HPC Cluster to Production with Ansible
In Part 1, we learned the fundamentals by building a single-node Slurm cluster. Now it's time to scale up to a production-ready, multi-node cluster with automated deployment, monitoring, and alerting.
In this post, we'll use Ansible to automate the entire deployment process, making it reproducible and maintainable.
Series Overview
- Part 1: Introduction, Architecture, and Single Node Setup
- Part 2 (This Post): Scaling to Production with Ansible
- Part 3: Administration and Best Practices
Moving from a single-node setup to a multi-node production cluster involves:
- Configuring multiple machines identically
- Managing dependencies and installation order
- Keeping configurations synchronized
- Handling user management across nodes
- Setting up monitoring and logging infrastructure
Doing this manually is error-prone and time-consuming. Infrastructure automation tools like Ansible, Puppet, or Terraform solve this problem. We chose Ansible because:
- Agentless: No software to install on managed nodes
- Declarative: Describe the desired state, not the steps
- Idempotent: Safe to run multiple times
- YAML-based: Easy to read and version control
- Large ecosystem: Many pre-built roles available
For quick review what is the Ansible, follow this video https://www.youtube.com/watch?v=xRMPKQweySE
Production Cluster Architecture
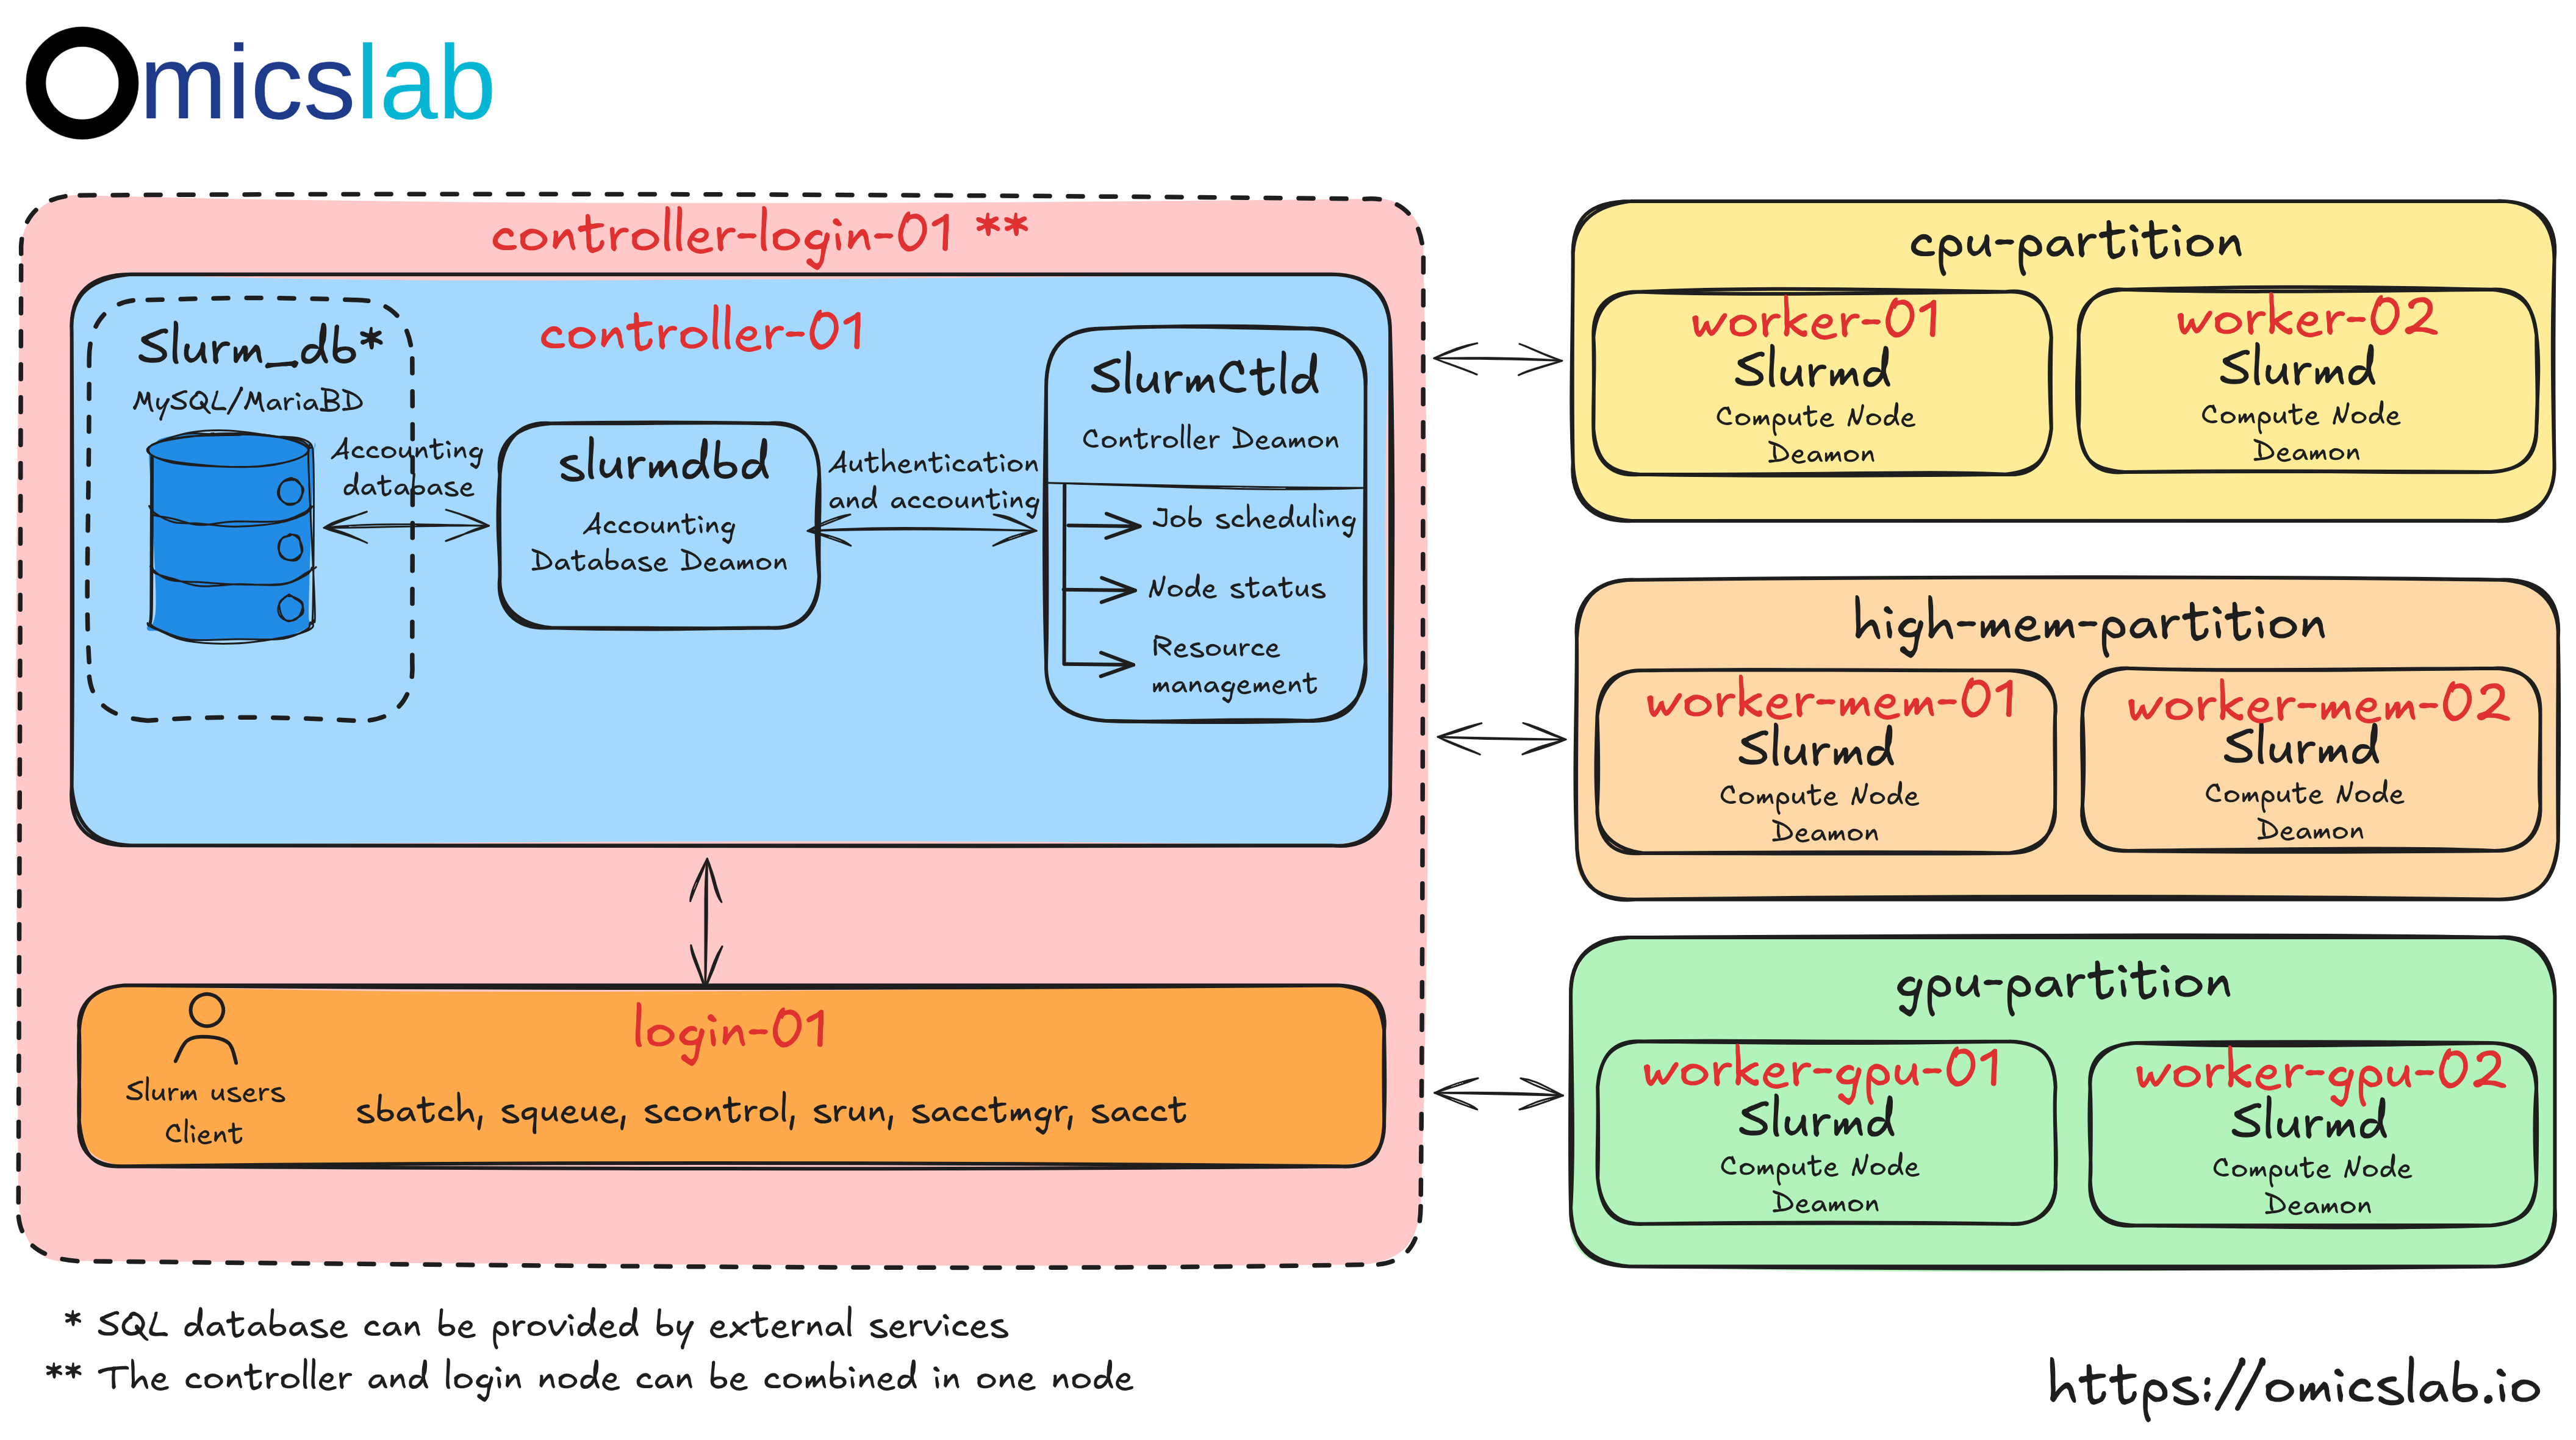
Figure 1: The standard architecture of a multi-node Slurm cluster
The above Figure 1 shows how the multiple nodes can be setup related to the Slurm cluster architecture only. However, on the real production, there are some additional steps that are required for the bioinformatics services, include: Shared Storage and Monitoring. It will be explained more details as below
Sharing Storage System
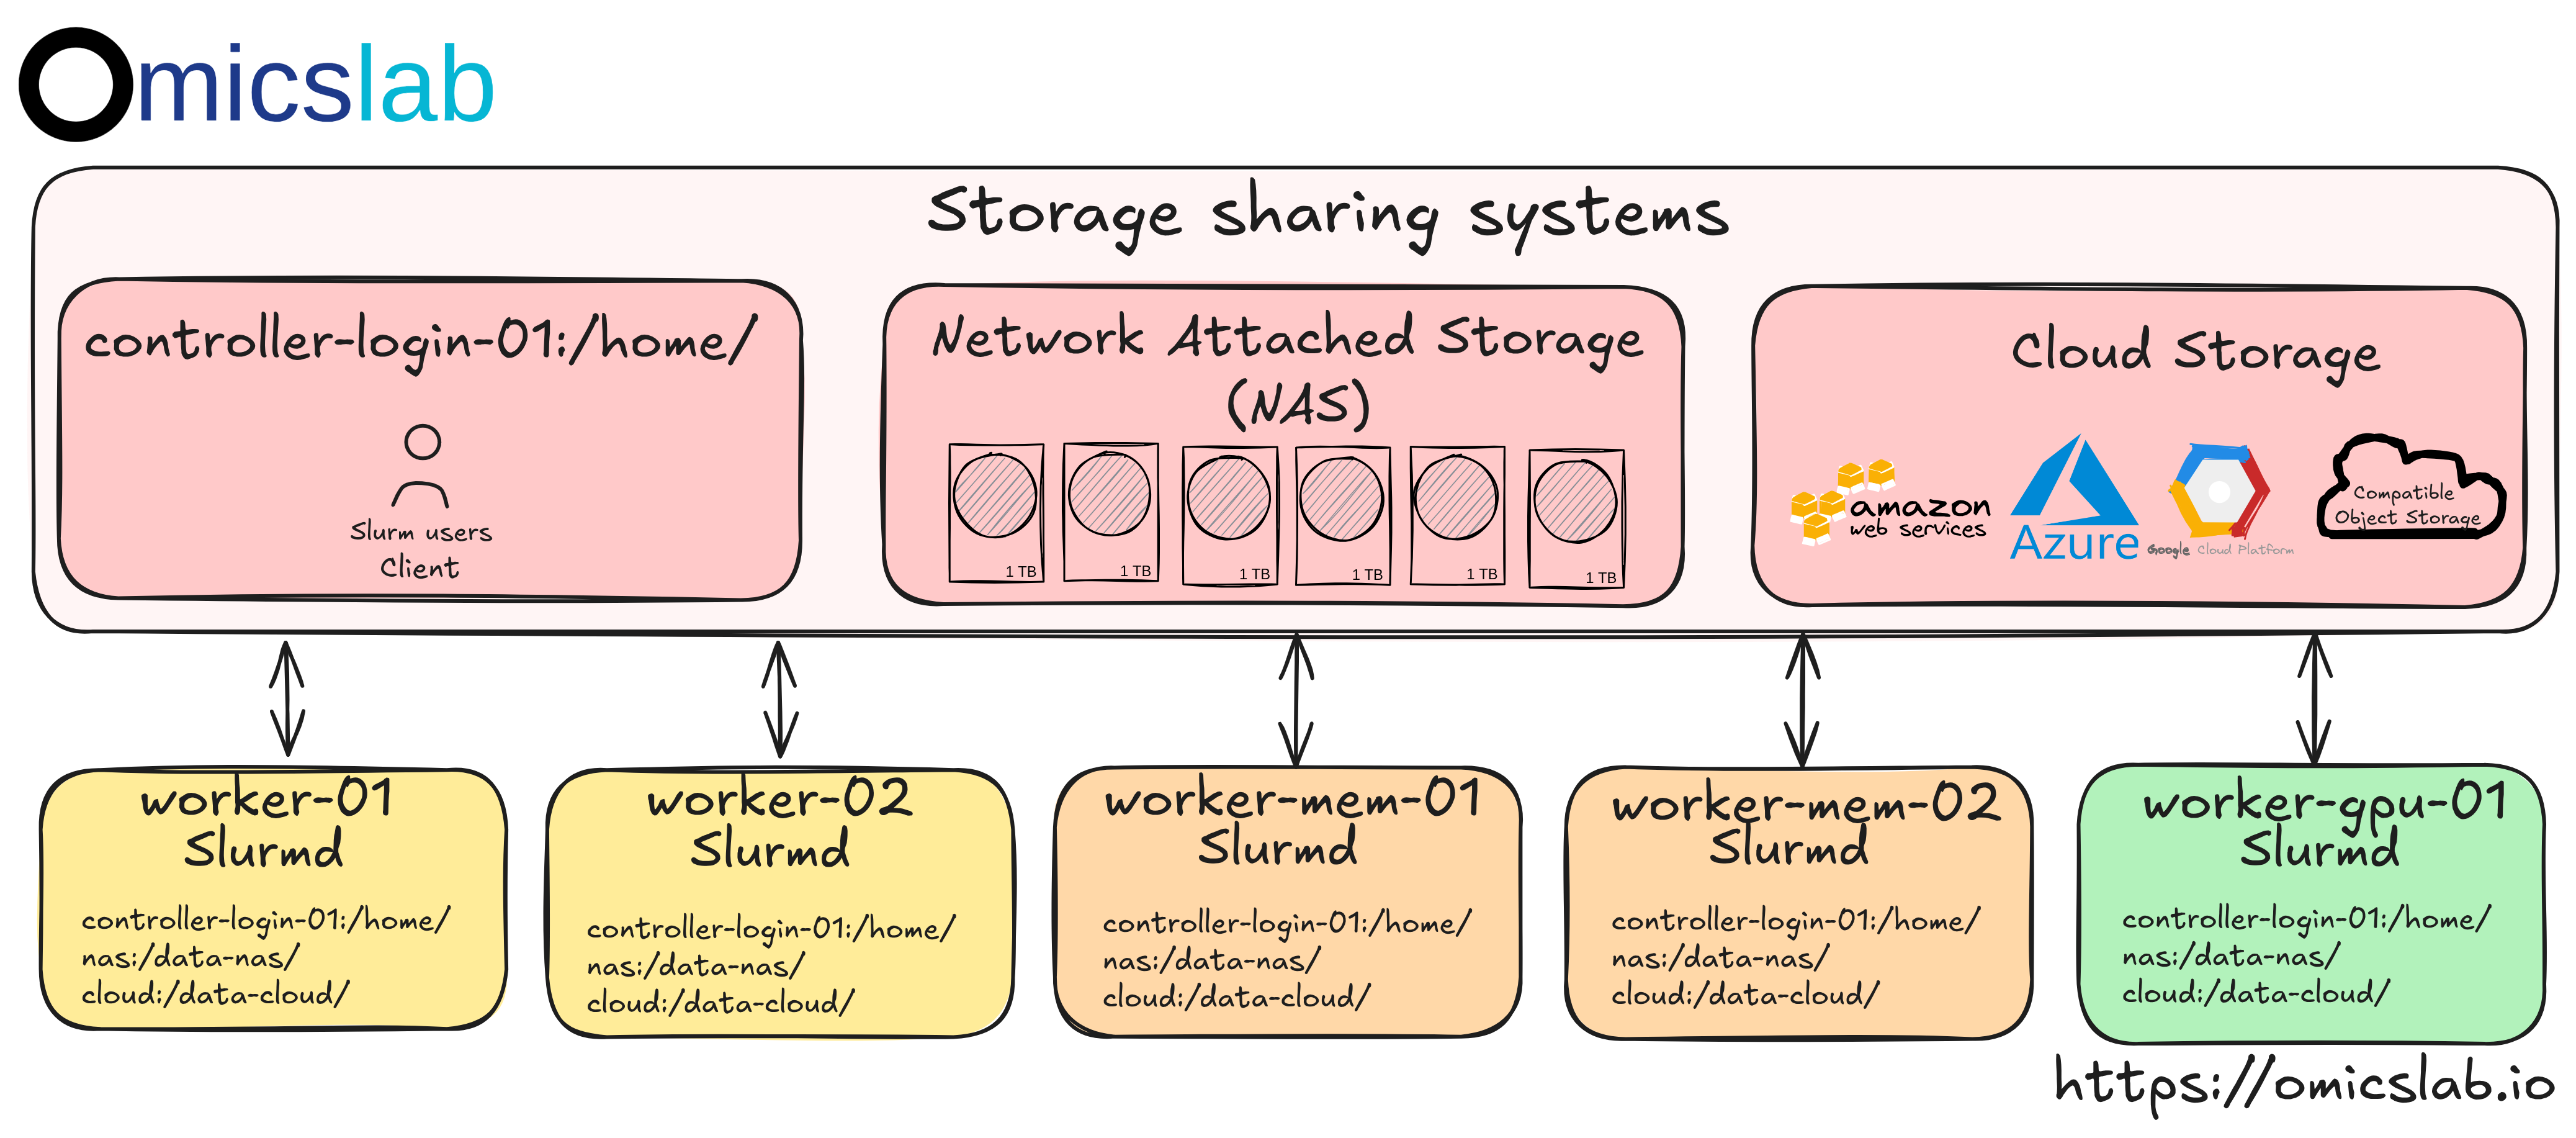
Figure 2: The standard sharing storage system accross multiple node
Why we need the sharing storage system, the simple idea is that when we ran a job on a worker, it need to access the data. Later, when we stop to work or request a higher resource system, we still be able to access the data. In advanced task, we need to analyze on multiple compute nodes, we need the raw data, intemediate files can be shared and storaged to be analyzed accross multiple machine.
Normally, the standardized setup can be showed as Figure 2, with:
- Network File Syste (NFS): With Local Area Network (LAN) wiht high network routers between nodes, it can be configured to share the specific folders from a machine to multiple nodes. It is usually configured
on the controller nodes where it shares the
HOMEdirectory, then your user home folder will be available on the target nodes. - Network Attached Storage (NAS) (Optional): Similar to NFS, it can be configured to the share files. Commonly, they are configured by specific device where it has the related NAS software to manage and monitor. Eventually, it can be shared with the public network. While it also can ensure the high accessibility to read/write between nodes and also ensure the backup the data using multiple replication of data. However, the cost for running the NAS can be considered where users can use the cloud storage directly. They can first download the raw data on the NFS, uploaded the nessesary files on the cloud when it done
- Cloud storage: Although the HPC is designed to use locally, using cloud storage is nessessary when user can store the data. In bioinformatics, it is quite special that the data can be reused to extract the new inside when the new tools are developed. While HPC is powered for computing to investigate, later, configuring cloud computing can be used for the production cost optimization.
Monitoring Stack
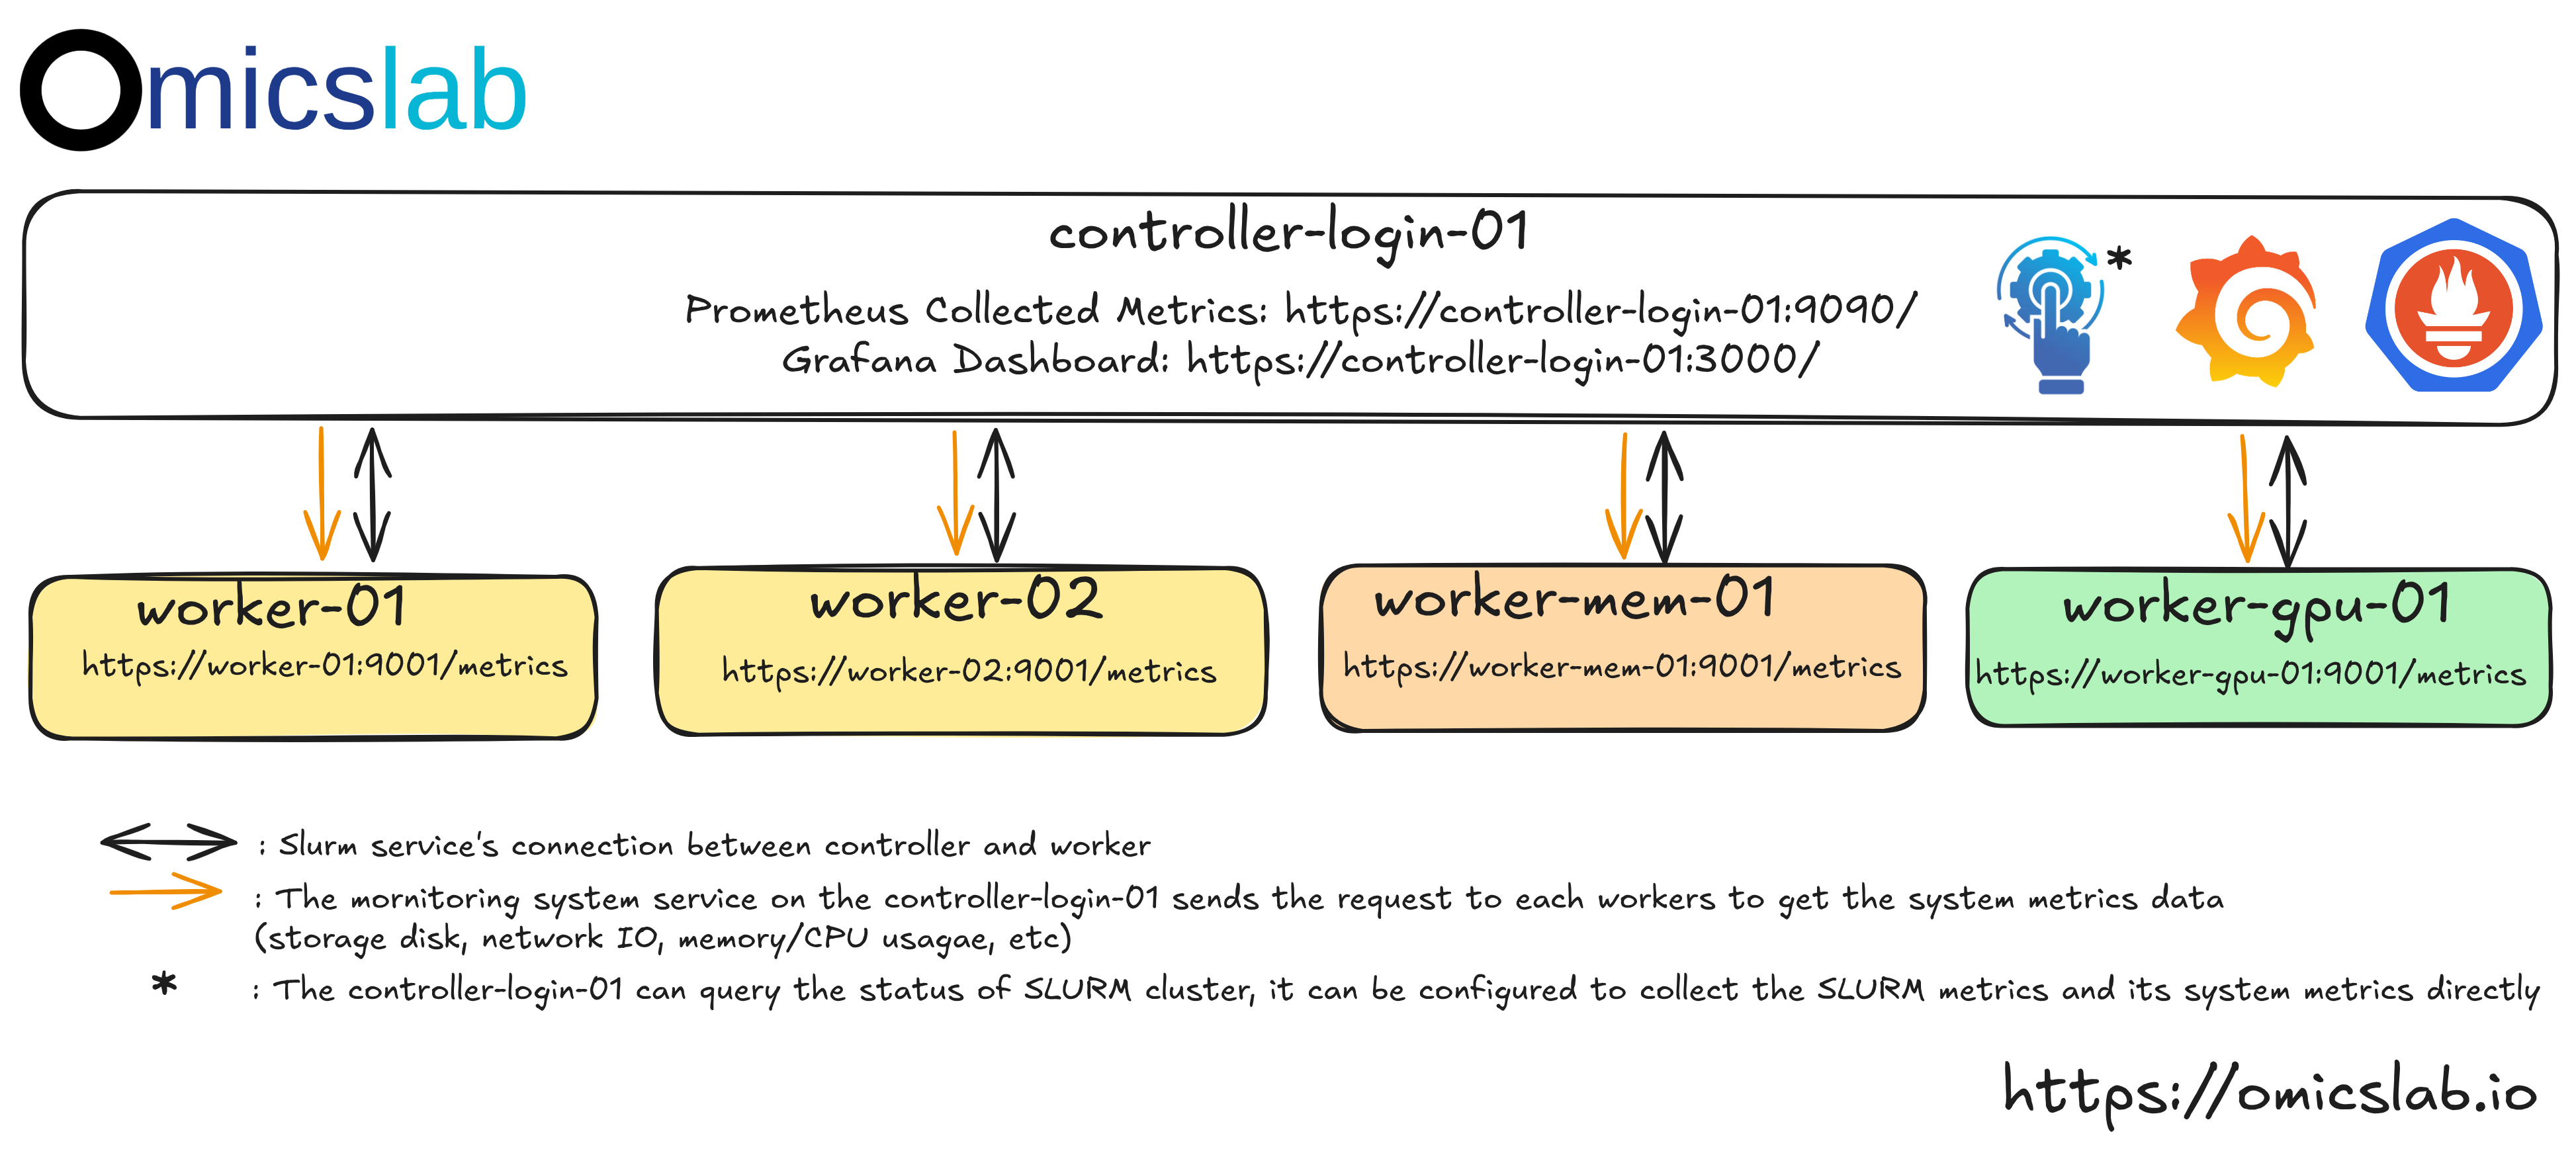
Figure 3: The monitoring system designed for multiple nodes to collect the system and Slurm metrics
As the administrator of the HPC, you should not login into the HPC, then check the status of the cluster. According to Figure 3, Normally, for the HPC, the administrator will:
- System monitoring: It is simply to check whether the users can use the HPC efficiently and effectively. It can be simply checked by the disk, memory and cpus usage. If the disk is full while, it can be the signal to increase
HPC node size. If the analysis can not be optimized, it is time to upgrade the system. It can detect whether the users use the HPC correctly. For example, running the Nextflow bioinformatics pipeline can be used with
executor=slurmit will help to automatically submit and monitor tasks while submitting a single job with high computing resources while running the pipeline withexecutor=localwill waste of resource when a few steps do not require too many resouces while it takes time to run. - Slurm monitoring: If the nodes are always busy (>80%) and expected to use more, it can be considered to update the HPC. Especially, the administrator can encourage and guild the users to submit job at night for extensive tasks while at this time, not much people use it
How the metrics can be collected:
- System metrics: It can be configured via
promethus-node-exporterat each node where it collect the system metrics and exposed as web api service athttps://<node name>:3000. Then, the head node can send the request to collect these metrics. - Slurm metrics: It can be configured via
promethus-slurm-exporterat the node in the Slurm cluster. It is usually the controller node. - Collected metrics and dashboard: Then the
prometheuswill collect these metrics and can be the source for theGrafanawith configured dasboard for interactive analysis
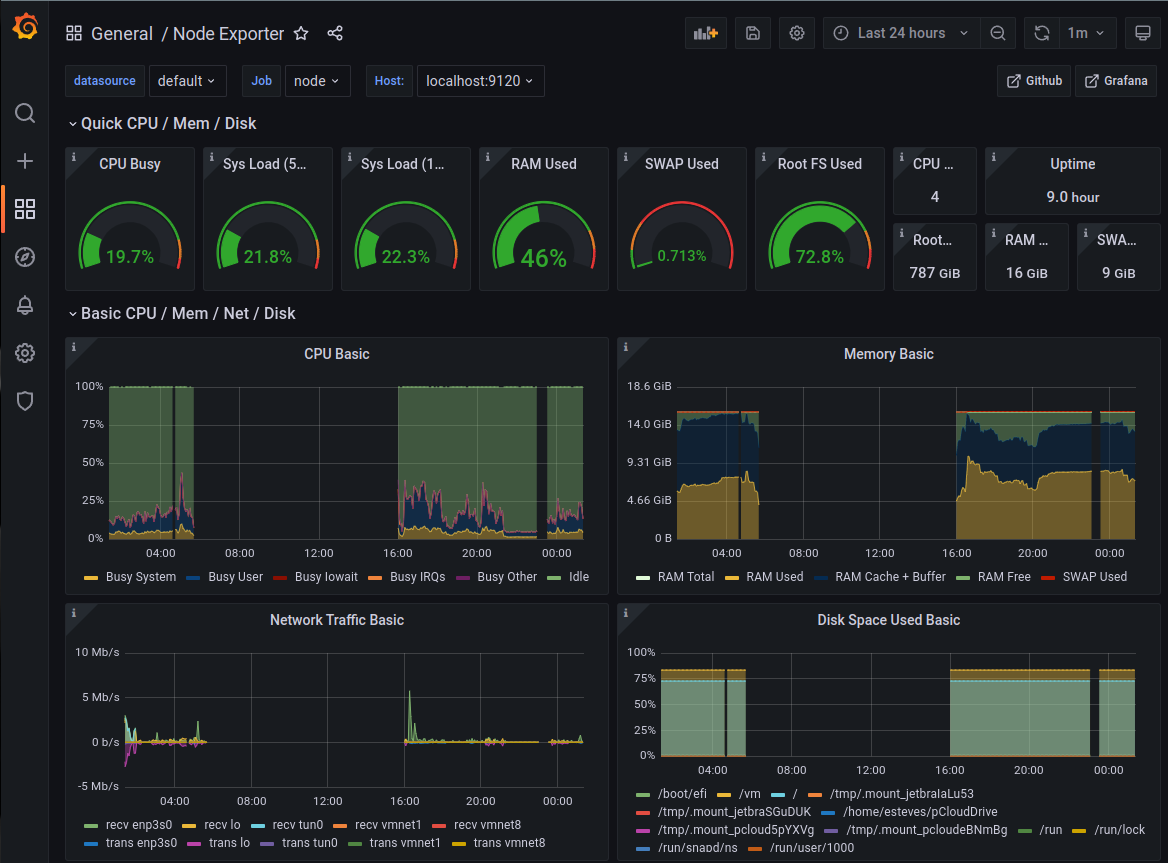
- Prometheus: Time-series metrics database
- Grafana: Beautiful dashboards for visualization
- Alertmanager: Sends alerts to Slack when issues occur
- Node Exporter: System-level metrics (CPU, memory, disk)
- Slurm Exporter: Slurm-specific metrics (jobs, partitions, nodes)
Alert System
The HPC does not always work properly. If a worker not does not work, the administrator should get the notification as soon as possible instead of waiting for the users to report the incidents. Therefore, prometheus can be
intergrated with alertmanager. Simply, we can configure the rule: If the system metric can not be collected from a node, it does not response, then it should mark as the down node and absolutely send the alert message to
the chat application. It can be Slack or Zalo (Vietnam region) that can be quickly fix the issue.
Scale To Multiple Node HPC
It can be done step by step, via:
- Step 1: Clone the repo
- Step 2: Install Ansible which is the tool that will connect and run the command line to setup on the remote machine (nodes)
- Step 3: Create the Slack app where it has the API that
Promethuswhen it see thehealthycondition is failed, will call the API to alert the administrators and users - Step 4: Connect your machine to be able to connect with nodes, create the
inventorieswhich store the information of how your machine can connect and set up on the nodes, decide which node should be configured as the controller, login, worker to install with relative services. - Step 5: Now you are able to build the cluster, using Ansible, read the
inventoriesfile and install/configure the softwares on the remote machine automatically instead of manually login to each nodes and install softwares - Step 6: Now the cluster can be ready to run, you need to add the users to correctly matched with the Linux users accross nodes for approriate permissons to work on the cluster.
- Step 7: Using the created Slurm user, verify the cluster can be submitted job and ran the simple analysis
- Step 8: Double check at the dasboard to see that each nodes system metrics and Slurm HPC metrics are visualized by Grafana
Prerequisites
- Multiple Ubuntu 20.04 or 24.04 machines (or VMs)
- SSH access to all nodes
- Sudo privileges on all nodes
- A Slack workspace (for alerts)
Step 1: Clone the Repository
git clone https://github.com/vieomics/omicslab-hpc -b 1.0.0cd omicslab-hpcStep 2: Install Ansible and Dependencies
# pixi is similar to conda# install piximake ${HOME}/.pixi/bin/pixi
# activate environmentpixi shell
# install dependencies, start up example instances with cluster os, support multiple version# bash scripts/setup.sh 22.04# bash scripts/setup.sh 20.04bash scripts/setup.sh 24.04# ormake vm-startThis script installs:
- Community Ansible collections
- Galaxy roles (geerlingguy.docker, etc.)
Step 3: Set Up Slack Alerts
- For
alertmanagerSlack is used by default. Contact us atcontact@omicslab.iothat we provide the customized solution if you want to use another solution (Zalo, Discord, etc)
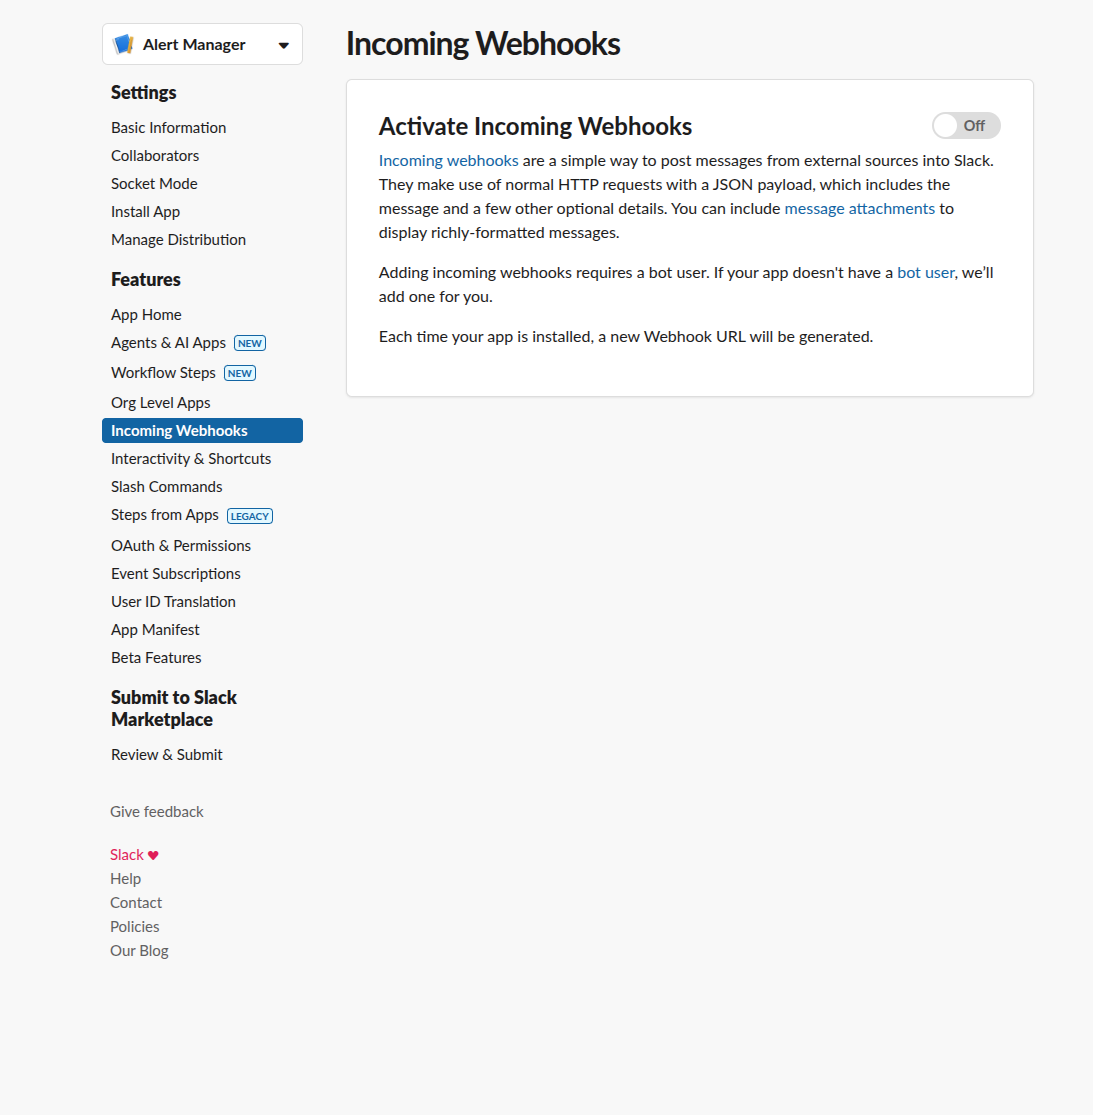
Create a Slack App
- Go to Slack API and create a new app
- Choose "From scratch"
- Name it (e.g., "Slurm Cluster Monitor")
- Select your workspace
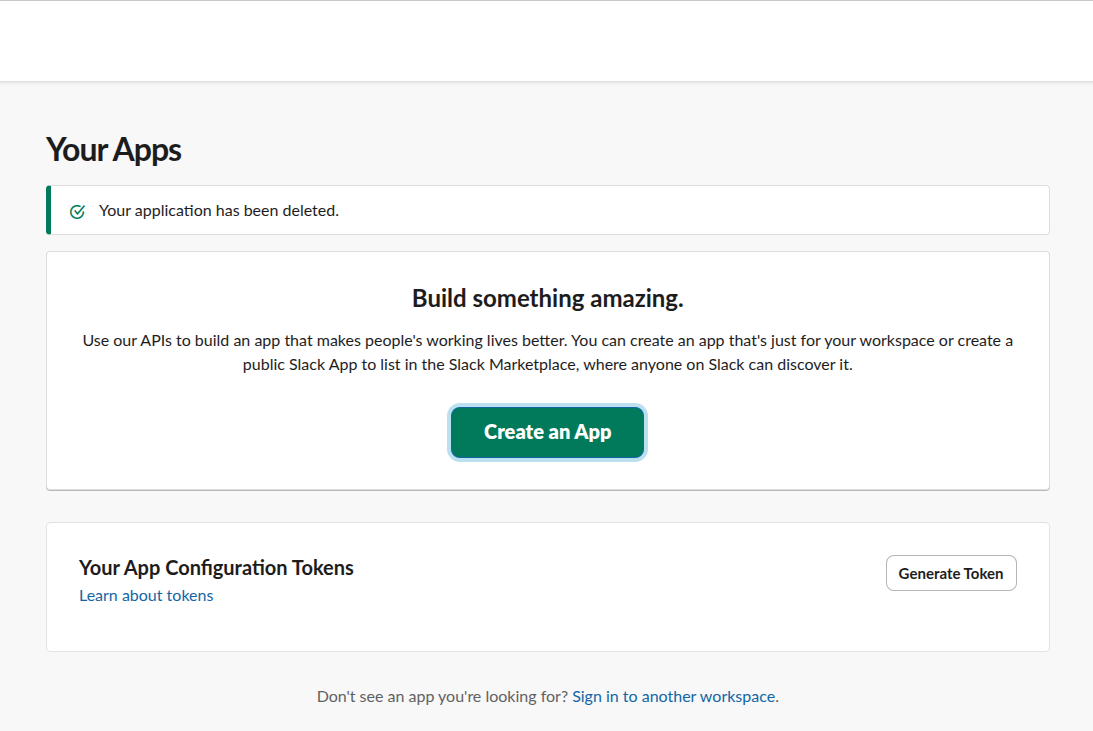
Enable Incoming Webhooks
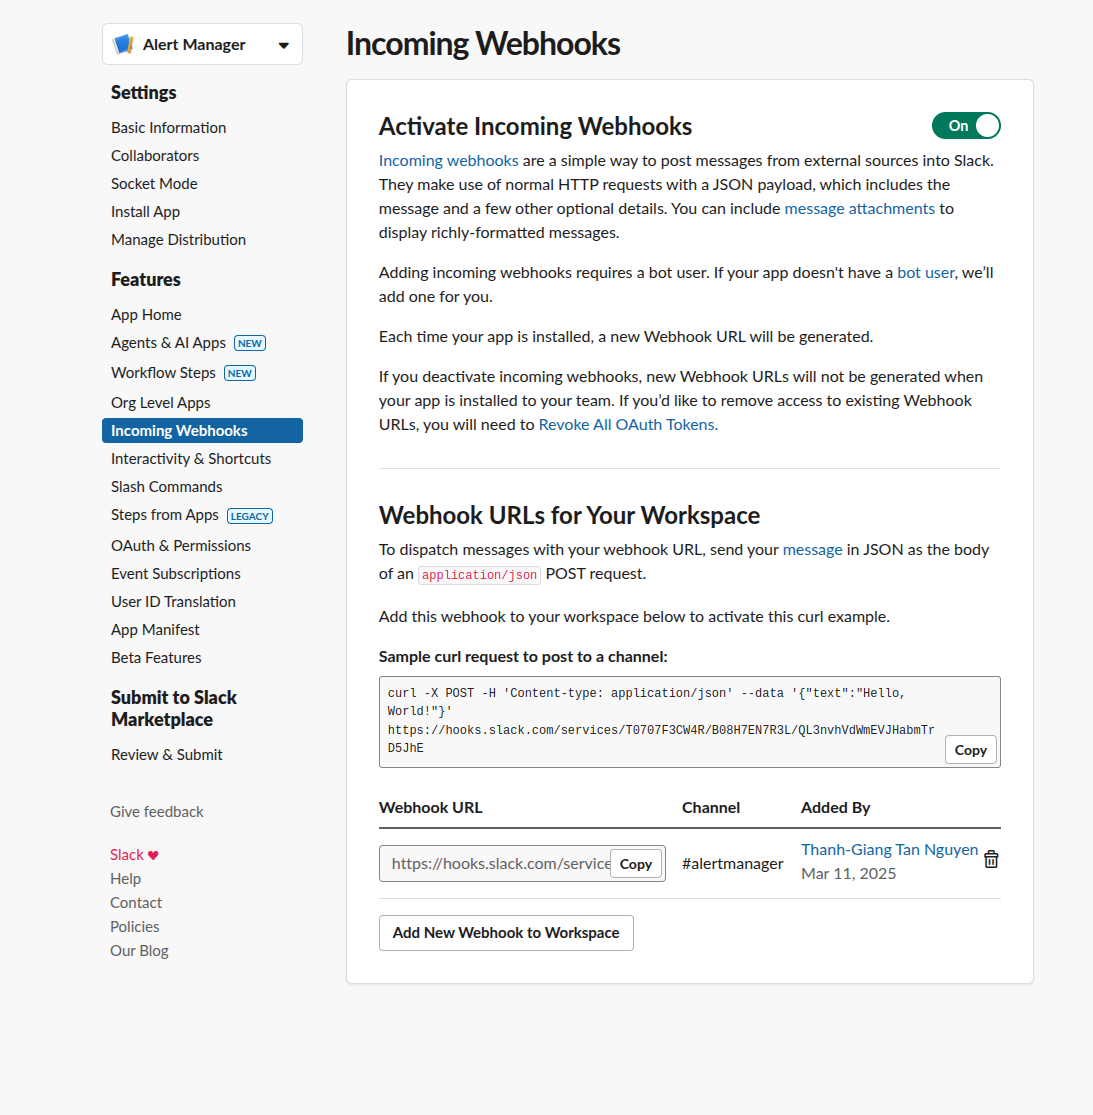
- Navigate to "Incoming Webhooks" in your app settings
- Activate incoming webhooks
- Click "Add New Webhook to Workspace"
- Select the channel for notifications (e.g.,
#cluster-alerts) - Copy the webhook URL
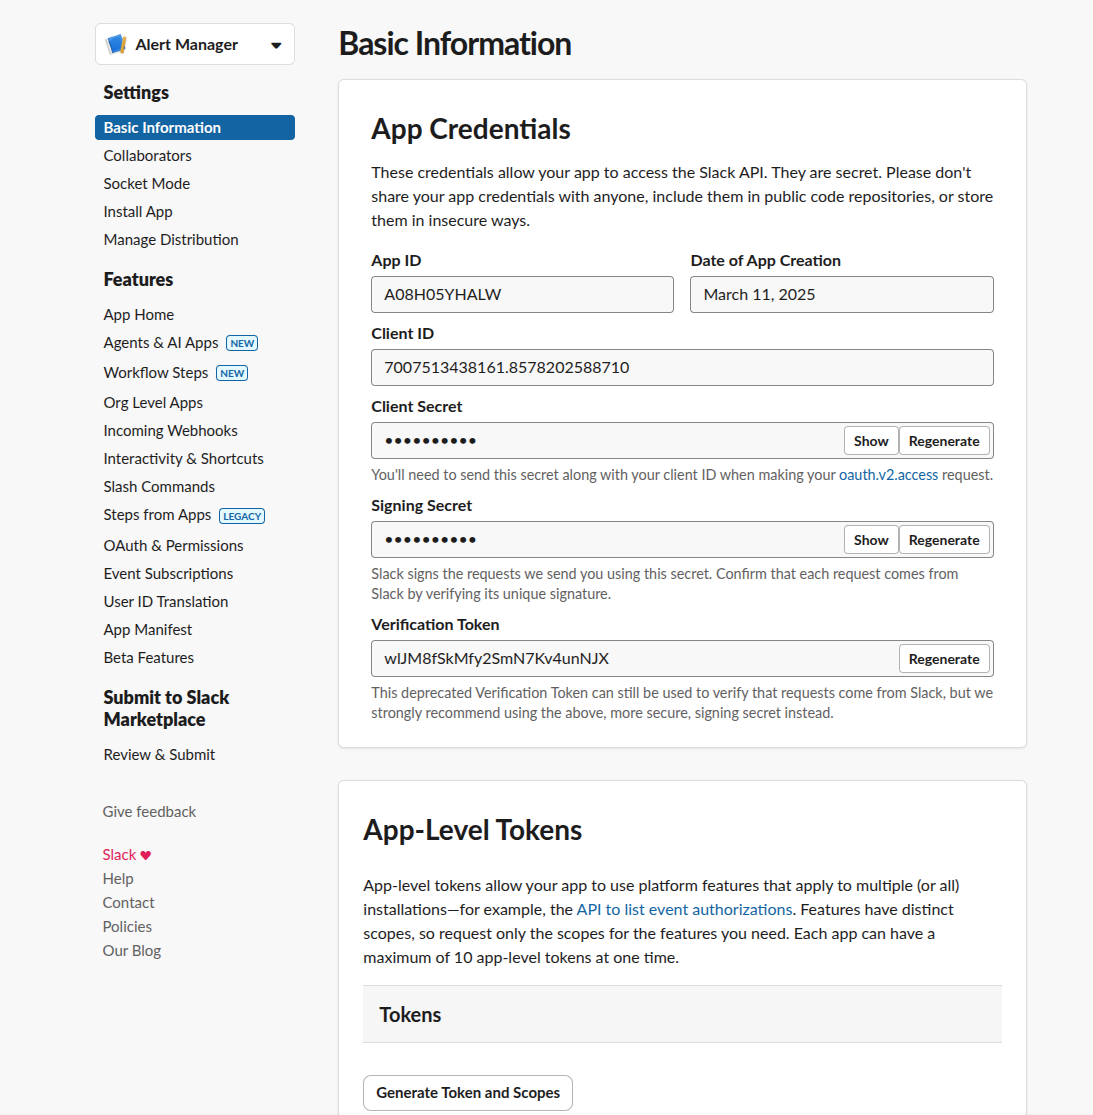
Manually Test The Webhook
curl -X POST -H 'Content-type: application/json' \ --data '{"text":"Hello from Slurm cluster!"}' \ https://hooks.slack.com/services/YOUR/WEBHOOK/URLYou should see the message appear in your Slack channel!
Step 4: Configure Your Inventory
Create inventories/hosts (or copy from inventories/hosts.example):
[slurm_master]controller-01 ansible_host=192.168.58.10
[slurm_worker]worker-01 ansible_host=192.168.58.11worker-02 ansible_host=192.168.58.12
[slurm:children]slurm_masterslurm_worker
\[all:vars] # remove the backflash that html turbopack failed to render as code blockansible_user=your_usernameslurm_password=secure_munge_passwordslurm_account_db_pass=secure_db_passwordslack_api_url=https://hooks.slack.com/services/YOUR/WEBHOOK/URLslack_channel=#cluster-alertsadmin_user=adminadmin_password=secure_grafana_passwordUse Ansible Vault to encrypt sensitive variables like passwords and API keys.
# create encrypted vault, add your vault password, content, then exit with vim key :wqansible-vault create inventories/hosts.prod
# edit exisiting files, add your vault password to work directly insideansible-vault edit inventories/hosts.prodOptional Parameters
default_password=temporary_user_password # Forces change on first loginusers=alice,bob,charlie # Comma-separated listStep 5: Deploy the Cluster
Now for the magic moment - deploy your entire cluster with one command!
# If you have passwordless sudo configuredansible-playbook -i inventories/hosts cluster_slurm.yml
# If you need to enter sudo passwordansible-playbook -i inventories/hosts cluster_slurm.yml --ask-become-pass --ask-vault-passWhat this playbook does:
- Prepares all nodes:
- Updates packages
- Installs dependencies
- Configures firewalls
- Sets up the controller:
- Installs slurmctld and slurmdbd
- Configures MariaDB for accounting
- Sets up NFS server
- Installs monitoring stack
- Configures compute nodes:
- Installs slurmd
- Mounts NFS shares
- Configures metrics exporters
- Deploys monitoring:
- Prometheus for metrics collection
- Grafana with pre-configured dashboards
- Alertmanager with Slack integration
- Synchronizes configurations:
- Copies slurm.conf to all nodes
- Sets up Munge authentication
- Configures log aggregation
Step 6: Add Users
ansible-playbook -i inventories/hosts cluster_account.ymlThis creates Linux users on all nodes with:
- Synchronized UID/GID across nodes
- Home directories on shared NFS
- Slurm accounting associations
For production, consider integrating with LDAP or Active Directory. However, NIS and LDAP setup can be complex on Ubuntu. Our Ansible approach provides a simpler alternative that works well for small to medium clusters.
Step 7: Verify the Setup
SSH into the controller node and run:
# Check cluster statussinfo
# Expected output:# PARTITION AVAIL TIMELIMIT NODES STATE NODELIST# compute* up infinite 2 idle worker-01,worker-02
# View job queuesqueue
# Submit a test jobsrun --nodes=1 --ntasks=1 hostname
# Check accountingsacct
# View cluster configurationscontrol show config | head -20Step 8: Access Grafana Dashboards
Grafana runs on the controller node at port 3000. To access it securely from your local machine:
# Create SSH tunnelssh -N -L 3001:localhost:3000 your_user@controller_ip
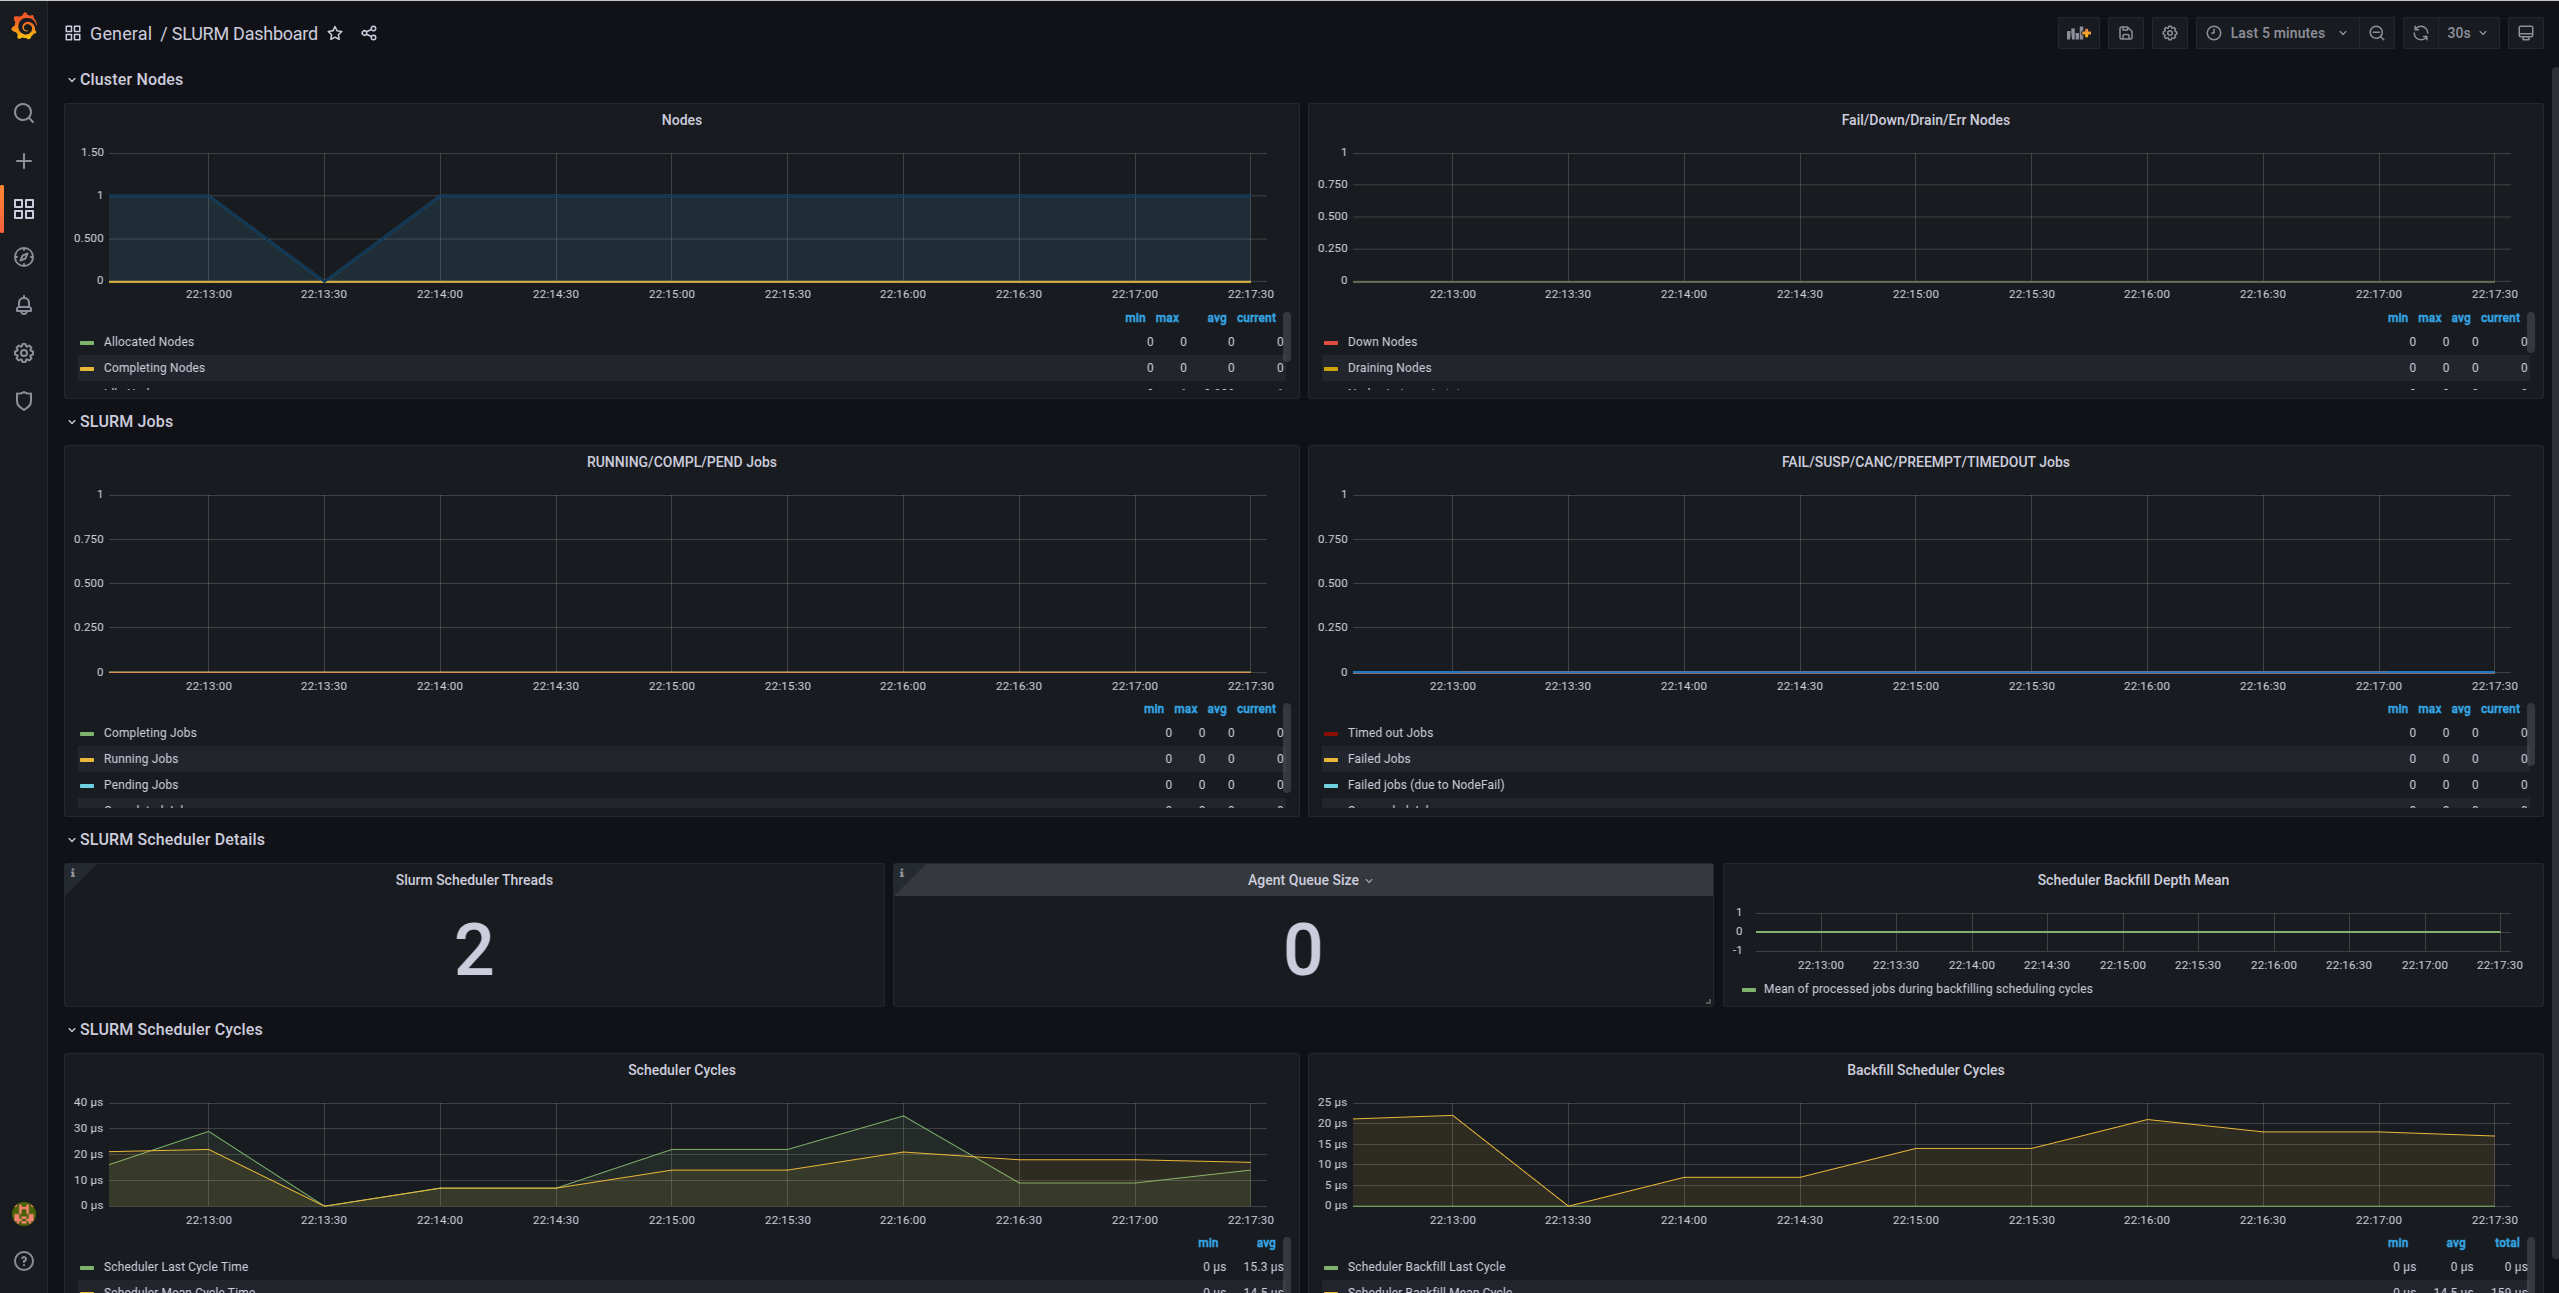
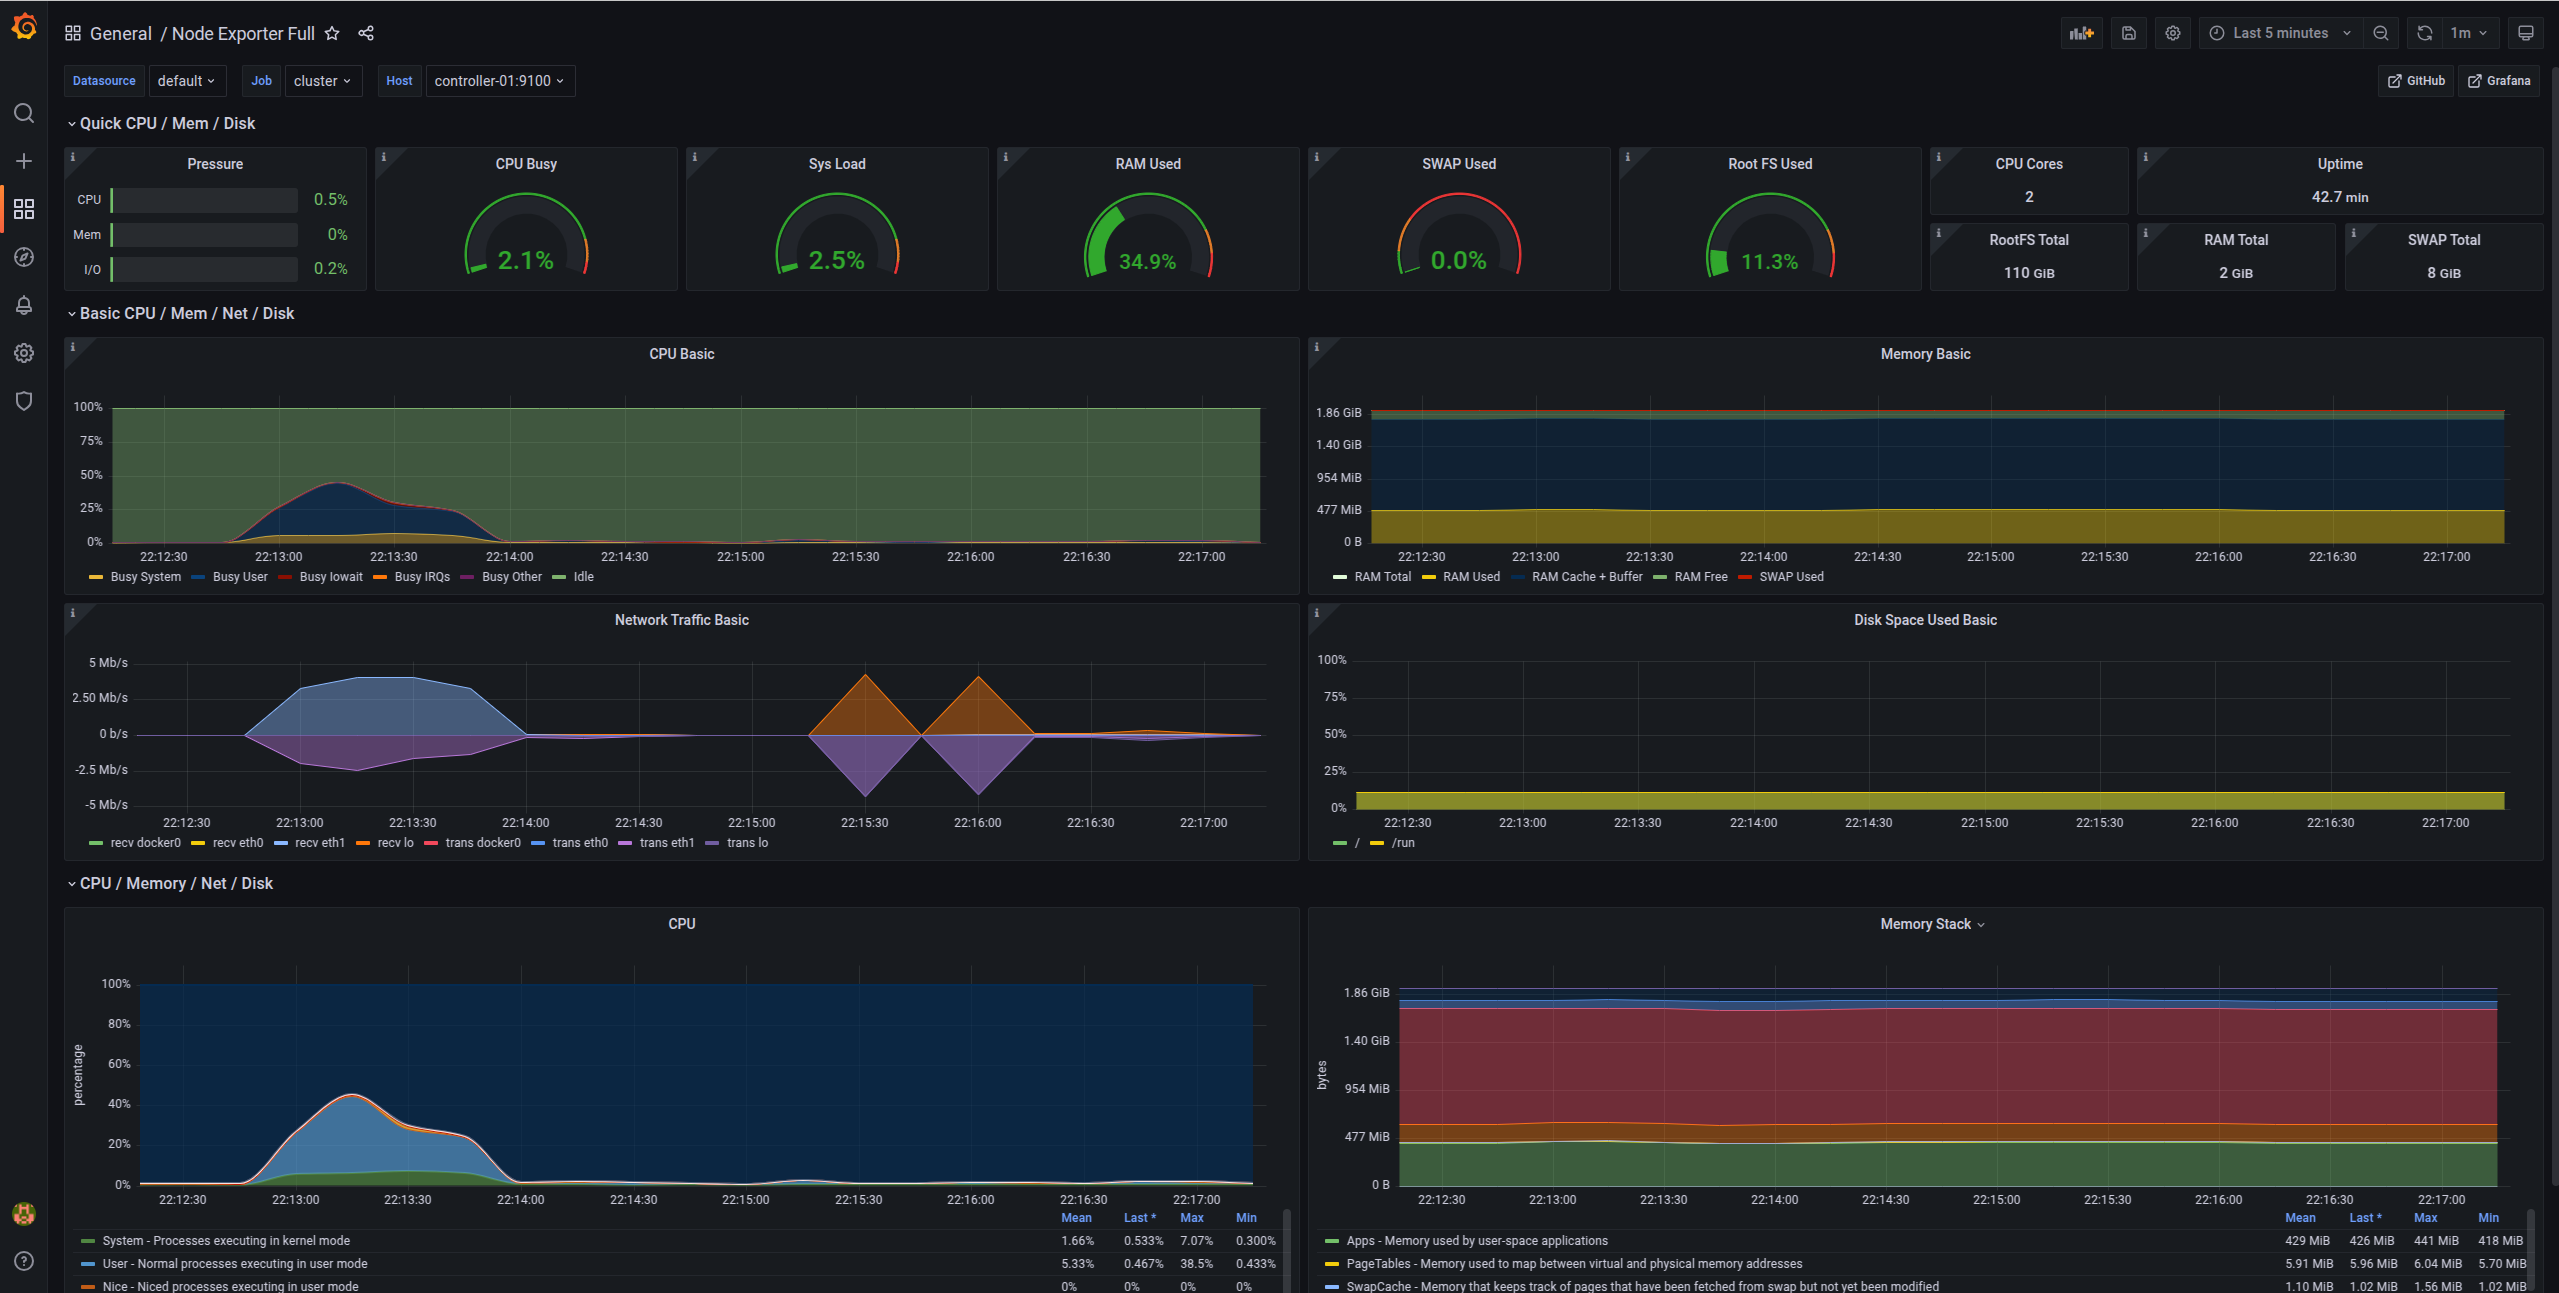
# Now open in browser: http://localhost:3001# Login: admin / your_grafana_passwordYou'll see pre-configured dashboards showing:
Node Metrics Dashboard
- CPU usage per node
- Memory utilization
- Disk I/O
- Network traffic
- System load
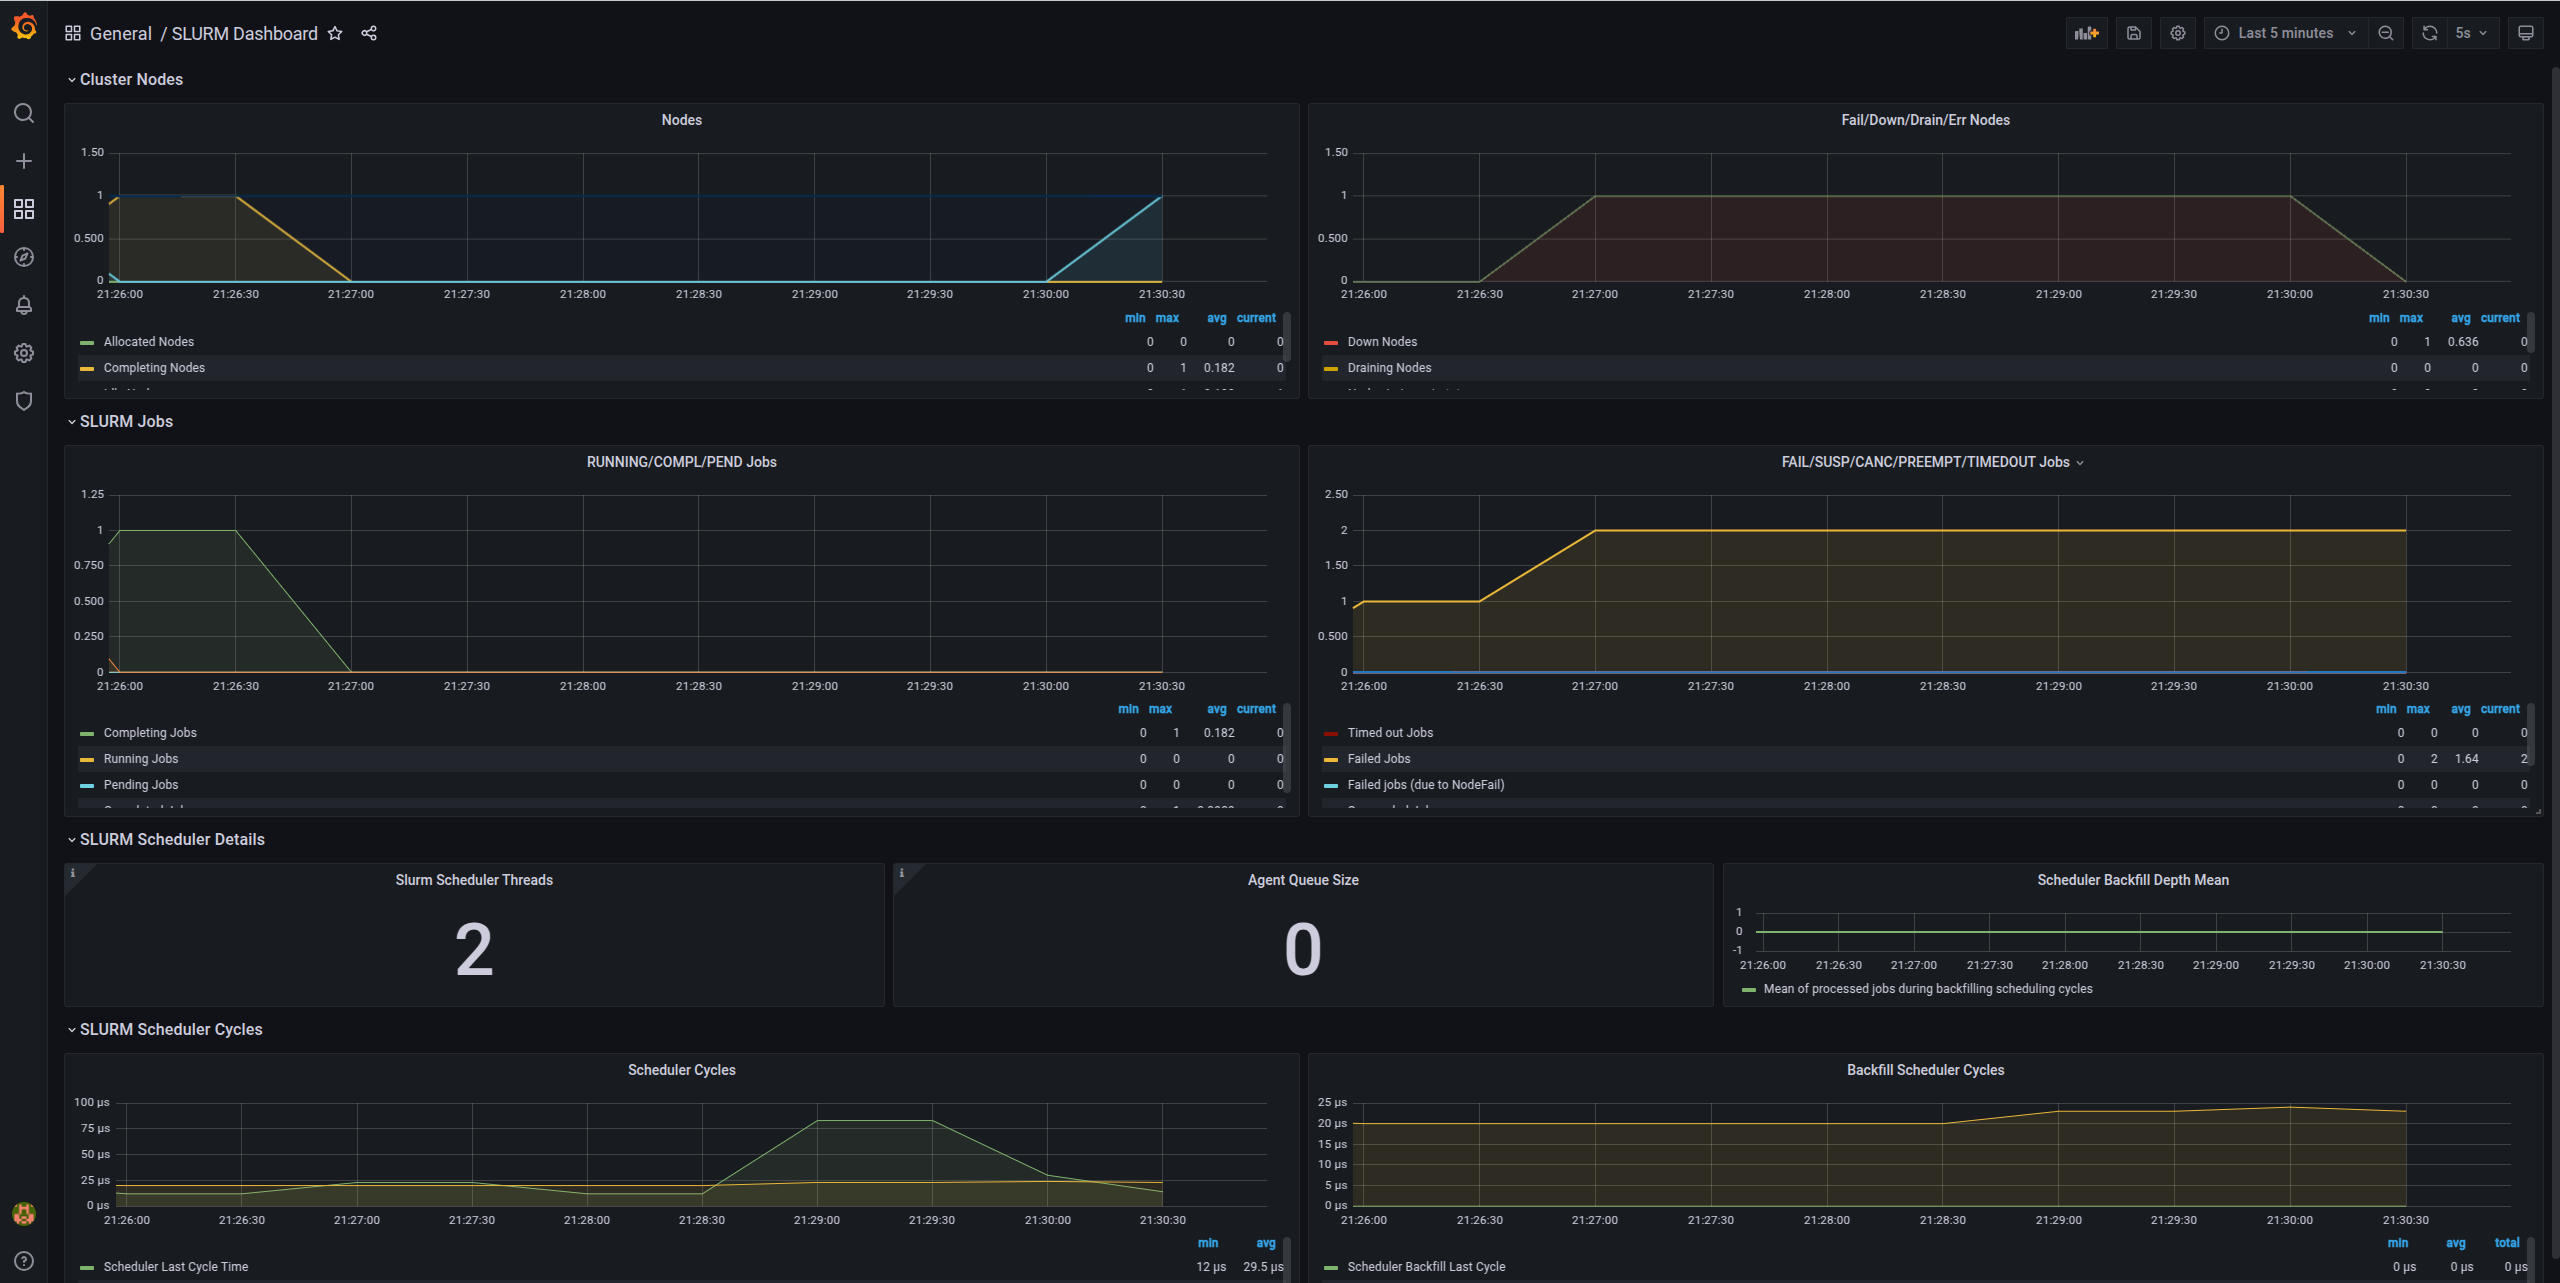
Slurm Metrics Dashboard
- Active jobs
- Job queue length
- Node states (idle, allocated, down)
- CPU allocation
- Memory usage
- Job completion rates
What About Alerts?
Alertmanager is configured to send Slack notifications for:
- Node down: When a compute node becomes unresponsive
- Node resumed: When a node comes back online
- High CPU usage: Sustained high CPU across cluster
- High memory usage: Memory pressure warnings
- Disk space low: Storage running out
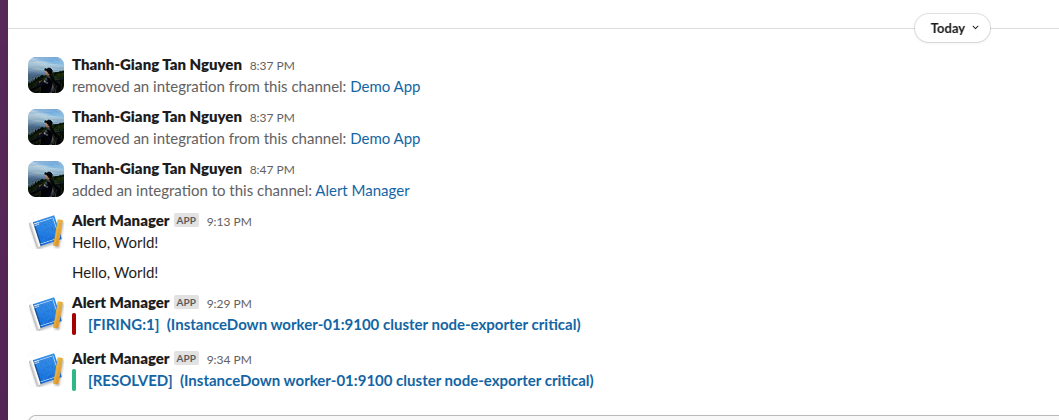
Example alert in Slack when a node goes down:
For detailed information, check the Grafana dashboard:
Testing Your Cluster
Let's run some tests to ensure everything works:
Test 1: Simple Job
srun hostnameTest 2: Multi-node Job
srun --nodes=2 --ntasks=2 hostnameTest 3: Interactive Session
srun --nodes=1 --cpus-per-task=2 --mem=2G --pty bash
# Inside the sessionhostnamenprocfree -hexitTest 4: Batch Job
Create test_job.sh:
#!/bin/bash#SBATCH --job-name=test#SBATCH --output=test_%j.out#SBATCH --error=test_%j.err#SBATCH --nodes=1#SBATCH --ntasks=1#SBATCH --cpus-per-task=2#SBATCH --mem=1G#SBATCH --time=00:05:00
echo "Job started at $(date)"echo "Running on node: $(hostname)"echo "CPUs allocated: $SLURM_CPUS_PER_TASK"echo "Memory allocated: $SLURM_MEM_PER_NODE MB"
# Do some worksleep 60
echo "Job finished at $(date)"Submit it:
sbatch test_job.sh
# Check statussqueue
# When done, view outputcat test_*.outTest 5: Resource Limits
# Submit job requesting more resources than availablesrun --mem=999999 --pty bash
# Should fail with:# srun: error: Unable to allocate resources: Requested node configuration is not availableTest 6: Accounting
# View your jobssacct
# Detailed accounting infosacct --format=JobID,JobName,User,State,Start,End,Elapsed,CPUTime,MaxRSS
# Cluster usage summarysreport cluster utilizationKey Takeaways
In this post, we've covered:
- Why Automation: The benefits of using Ansible for cluster management
- Production Architecture: Multi-node setup with monitoring and alerting
- Slack Integration: Proactive monitoring with notifications
- Automated Deployment: One command to deploy the entire cluster
- Verification: Testing your cluster thoroughly
In Part 3, we'll cover daily administration tasks, troubleshooting, security best practices, and advanced resource management.
References
1.Slurm Overview — Official documentation for Slurm workload manager
2.NVIDIA/deepops — Open-source cluster deployment toolkit (BSD-3-Clause License)
3.elasticluster — Elastic cluster provisioning tool (GPL-3.0 License)
4.Ansible- Ansible for IT Automation DevOps
5.GitHub Repository-Omicslab HPC- Ansible scripts for setting up the Slurm HPC
This is Part 2 of the Omicslab series on building Slurm HPC clusters. Continue to Part 3 for administration and best practices.